Recent Tools
No tools found matching your search.
↑↓ Navigate
←→ Category
↵ Select
esc Close
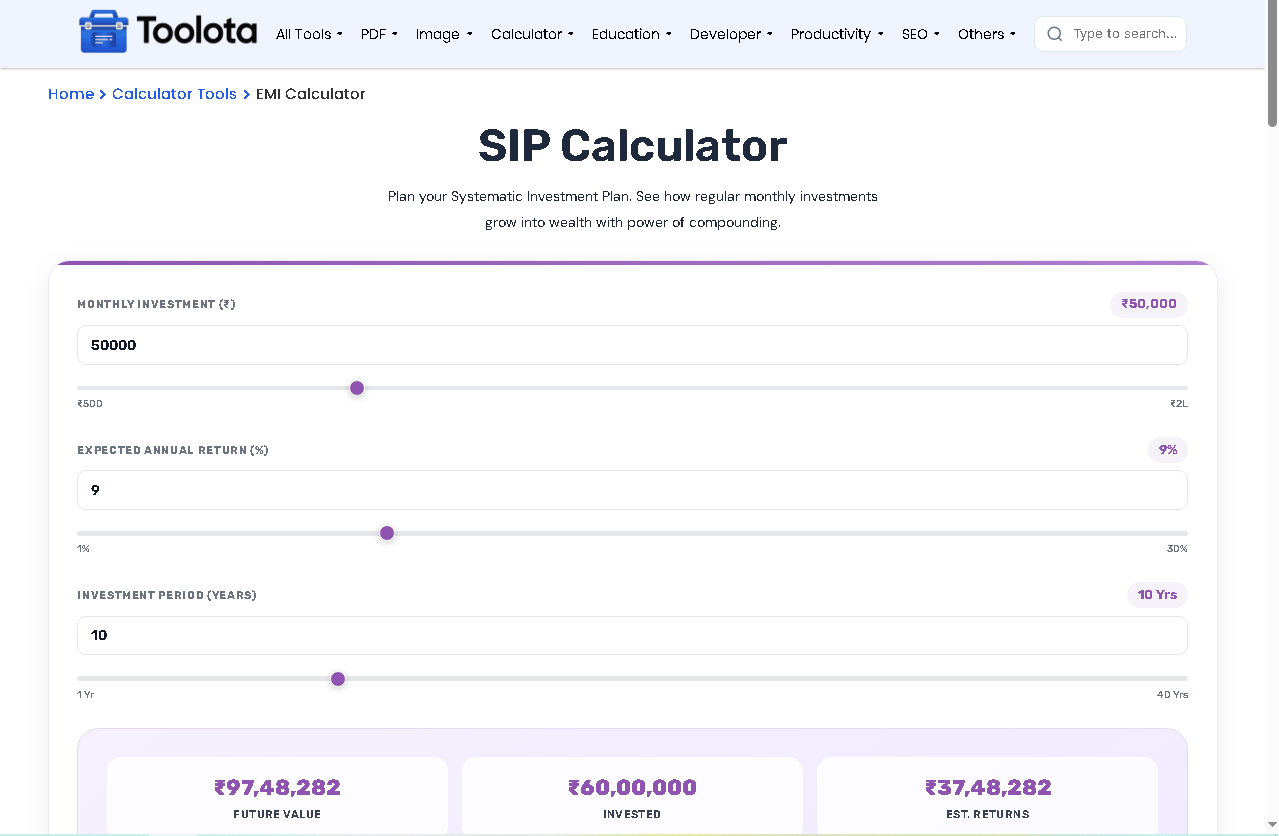
Plan your Systematic Investment Plan. See how regular monthly investments grow into wealth with the power of compounding.
Looking for a simple way to see how your monthly investments grow? This tool instantly shows your future wealth through the power of compounding. Simply enter your monthly amount, expected return rate, and time period to get accurate results. A systematic investment plan helps you build wealth gradually, and this calculator makes the math effortless.

Use the slider or type directly in the number field to set your monthly SIP amount (₹500 to ₹2,00,000). The value updates in real-time.

Choose a rate that matches your own assumption, since market returns vary and are never guaranteed.

Select how many years you want to invest – from 1 year up to 40 years. Longer periods show higher compounding returns.

Results update automatically as you change values. The Calculate button refreshes everything, and Reset clears all fields.
| Feature | What It Does |
|---|---|
| Monthly Investment Slider | Adjust from ₹500 to ₹2,00,000 with step-by-step control |
| Return Rate Slider | Set expected annual returns between 1% to 30% |
| Time Period Slider | Choose investment duration from 1 to 40 years |
| Number Input Fields | Type exact values directly for precision |
| Real-time Updates | Results change instantly as you adjust any slider |
| Stacked Bar Chart | Visual breakdown of invested vs. earned amount |
| Milestone Cards | Shows wealth after 25%, 50%, 75%, and full term |
| Reset Button | Clear all inputs and start fresh in one click |
Before starting a SIP, use the Investment Growth Calculator to compare lump-sum vs. regular investing outcomes.
Once you know your monthly surplus, check how it fits your overall budget with the Salary Calculator.
If you’re weighing a SIP against paying off debt faster, compare it with the EMI Calculator to see which saves or earns more over time.
This tool’s core strategy is what’s formally known as a systematic investment plan, which relies on rupee-cost averaging over time.
Three result boxes show Future Value, Total Invested Amount, and Estimated Returns – all formatted in Indian Rupees (₹).
Four milestone cards show the value of your portfolio after 25%, 50%, 75%, and 100% of your chosen period, so you can see your progress along the way.
Use sliders for quick adjustments OR type precise numbers. Both methods sync perfectly for your convenience.
The colored bar chart (purple for invested, light pink for returns) shows exactly how your wealth is built over time.
One tap clears every field and returns the planner to its starting state, so you can try a new scenario right away.
This SIP return calculator doesn’t just give you a final number – it shows your complete wealth journey. The formula used calculates monthly investment growth using compound interest: FV = P × [((1+r)^n – 1)/r] × (1+r). When you change the expected return rate, the stacked bar rebalances to show how much of your final amount comes from returns. The milestone cards help you stay disciplined by answering questions like “What will I have halfway through my plan?” and “What if I invest for longer?
It uses compound interest formula to calculate future value from monthly investments, rate of return, and time period.
There is no single correct rate. Market-linked investments can rise or fall, so many people try a cautious, a moderate, and an optimistic rate to see a realistic range of outcomes.
The shortest investment period this tool supports is 1 year. For a shorter plan, your total invested amount is simply your monthly amount multiplied by the number of months.
Yes – completely free with no registration, downloads, or hidden charges.
They assume a constant annual return rate – actual market returns may vary year to year.
Toolota is your all-in-one online tools platform. Fast, simple, and free utilities designed to make everyday digital tasks easier and smarter.