Calculate the mean, variance, and standard deviation for a set of data points instantly.
The Standard Deviation Calculator is a free online tool that gives you the mean, variance, and standard deviation for any set of numbers you enter. Just type or paste your data points and hit Calculate — you’ll get your statistical results in seconds. Whether you’re a student checking homework or a professional analyzing a sample, this online statistics calculator makes the math simple. How do you find the standard deviation quickly? Use this tool and see the results instantly.
All features listed below are visible directly in the tool’s interface.
Data Input Field — A text box where you enter your numbers, separated by commas or spaces.
Calculate Button — A single click that processes your data and displays all statistical values.
Clear Button — Instantly wipes your input and hides the results for a fresh start.
Mean (Average) Display — Shows the arithmetic mean of your data set.
Standard Deviation (σ) Display — Gives you the population standard deviation.
Variance (σ²) Display — Shows the variance calculated from your numbers.
Count (n) Display — Tells you how many data points you entered.
Responsive Layout — Works cleanly on desktops, tablets, and mobile screens.
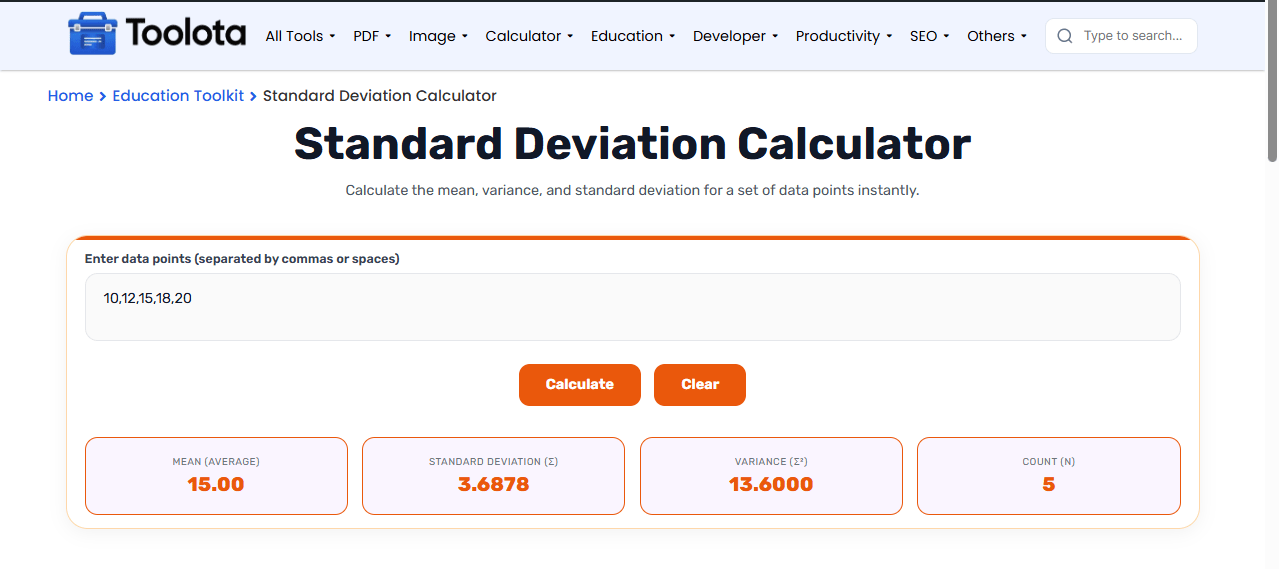

Type all data points into the text box using commas or spaces.

Press the orange button to instantly process your data.

View the mean, standard deviation, variance, and count in the grid below.
Need to find the standard deviation fast? Just type your numbers in, press Calculate, and the tool does all the work for you. No formulas, no manual math.
The numbers you see aren’t just abstract values. The mean tells you the center of your data, the variance shows how spread out your points are, and the standard deviation gives you a clear measure of that spread in the same units as your data. Together, these three values give you a complete snapshot of your data set’s distribution and consistency.
Always separate your numbers with a comma or a space for the tool to read them correctly.
If you get a strange result, check for typos — extra commas or missing numbers can affect the output.
Use the Clear button to remove old data and start a new calculation without reloading the page.
Click one button and get the mean, variance, and standard deviation immediately — no waiting.
The calculator is fully responsive, so you can use it on your phone, tablet, or computer.
The interface is straightforward: a text area, two buttons, and a clean results grid.
No sign-ups, no hidden costs. Just open the page and start calculating.
Standard deviation measures how spread out the numbers in your data set are from the mean. A low value means data points are close to the average, while a high value indicates wider variation.
Type your numbers in the text box, separated by commas or spaces. For example: 10, 20, 30, 40 or 10 20 30 40.
Yes. The interface adjusts to any screen size, so you can use it on your phone, tablet, or desktop computer.
This tool calculates the population standard deviation, dividing by the total count of data points (n).
The tool requires at least two data points to compute meaningful results. If you enter fewer than two, you’ll see an alert reminding you to add more numbers.
Toolota is your all-in-one online tools platform. Fast, simple, and free utilities designed to make everyday digital tasks easier and smarter.